
In today’s article, we’ll examine the recent performance of Russell 2000 ETF (IWM) Through a lens Elliot wave theory. We’ll review how the strong rally from the November 2025 low developed as a 5-wave impulse and discuss our evolving forecast for what’s next. Let’s delve into the structure and outlook of this tech giant.
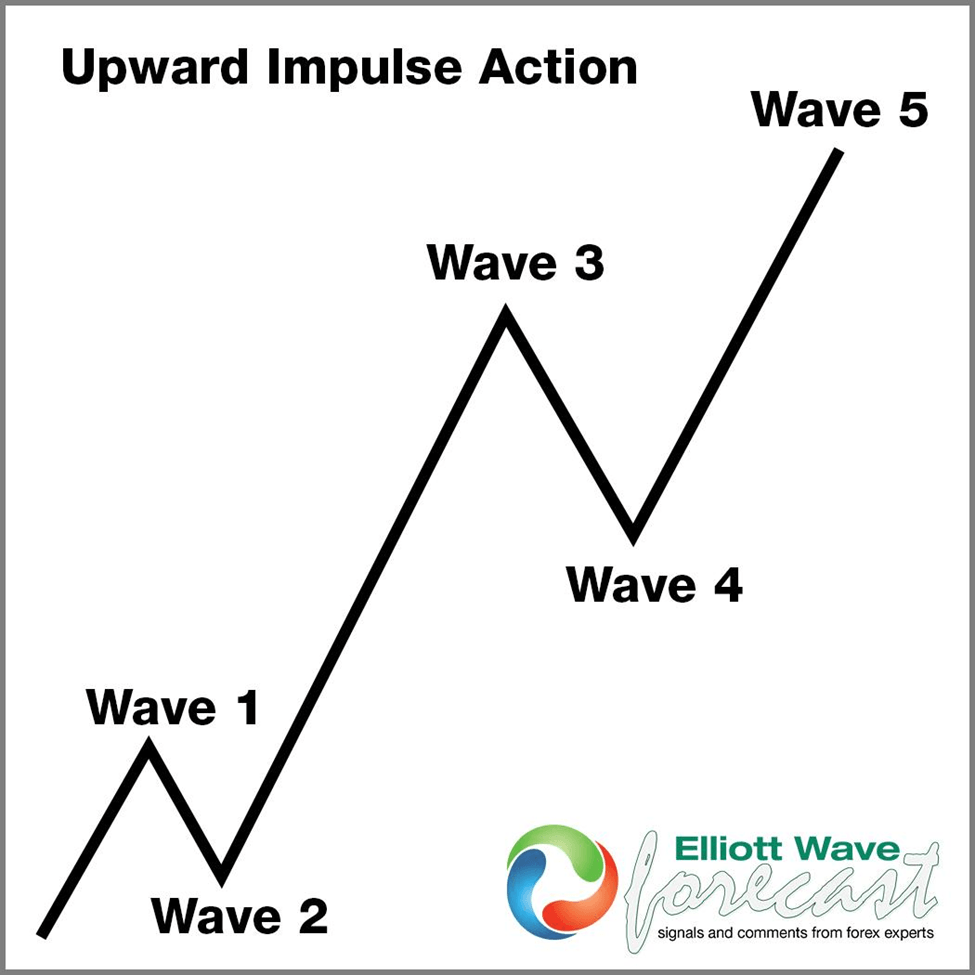
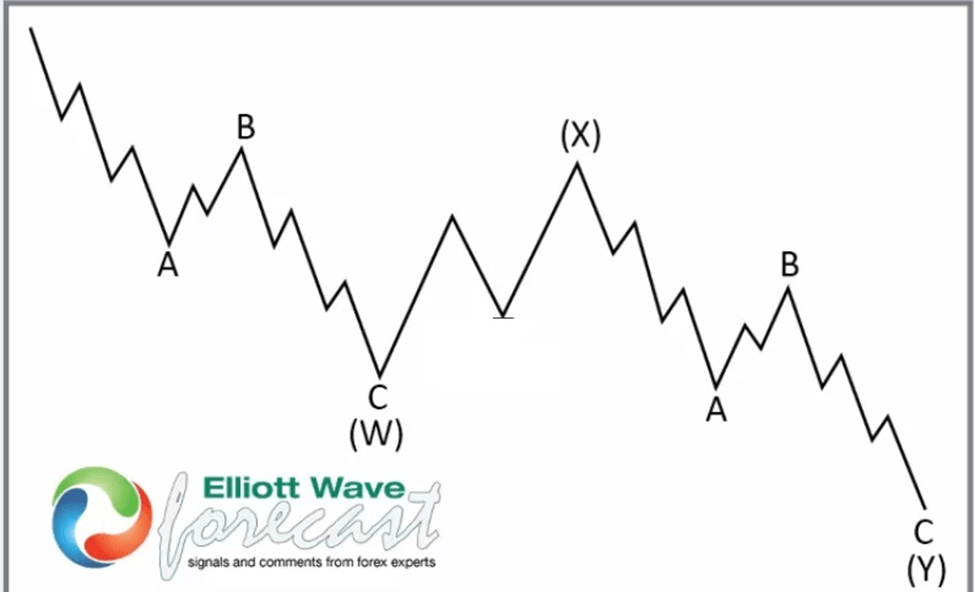
Five impulse waves + seven WXY corrections
IWM 4-Hour Elliott Wave Chart at 11.18.2025
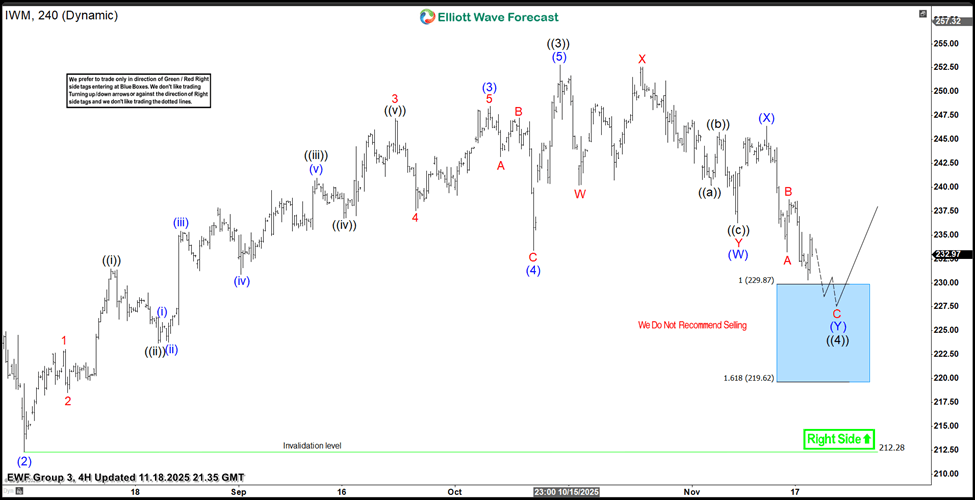
In the 4-hour Elliott wave count from November 18, 2025, we saw that $IWM completed a 5-wave impulsive cycle in black ((3)). As expected, this initial wave led to a pullback. We expect this pullback to unfold in 7 swings, and we are likely to find buyers in the blue box area between $229.87 and $219.62.
IWM four-hour Elliott wave chart dated 12.08.2025
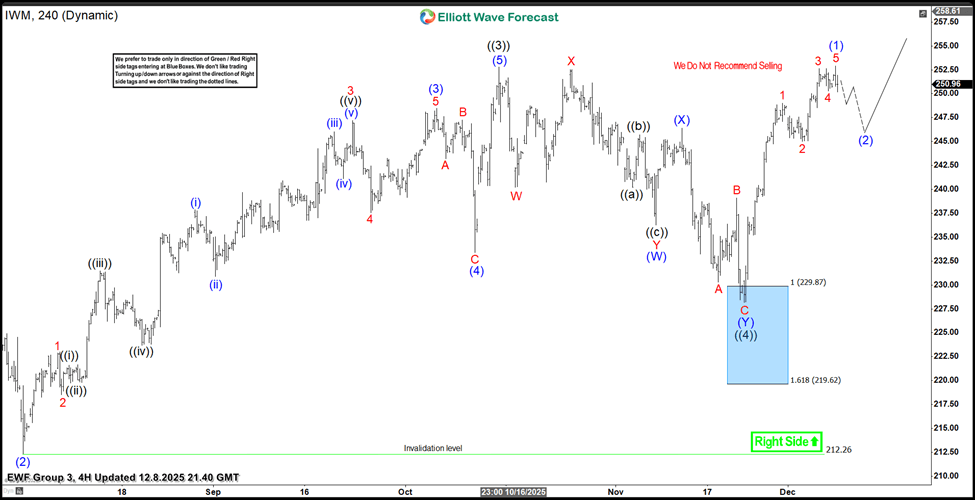
The latest update shows the strong reaction from the blue box area. The ETF managed to rise by 11% and reached all-time highs. Right now, the ETF is looking for a pullback to absorb the recent gains and continue the rally. We believe $IWM can reach $258 – $268 the next.
conclusion
In conclusion, the Elliott Wave analysis for the USD IWM continues to prove accurate, suggesting that the ETF remains well supported against the November 2025 lows. Therefore, for traders who took advantage of the entry opportunities presented in the “blue box” area, $258-$268 area It should be closely monitored as the next important target. In the meantime, vigilant monitoring of any healthy corrective pullbacks could provide new entry opportunities for those looking to join the trend.
Ultimately, by applying the principles of Elliott Wave Theory, traders can gain a deeper understanding of market cycles, better anticipate the structure of upcoming moves, and ultimately enhance their risk management strategies in dynamic markets like IWM’s current market.

