
Sterling continues to draw support from broad-based yen weakness this week and remains firm near multi-year highs, at 208.90, with downside attempts above 208.20 contained so far.
The Japanese yen fell against its major counterparts this week, weighed by a combination of bleak economic growth numbers and concerns amid plans by Prime Minister Talkaichi’s government to launch a US$137 billion stimulus program that will increase pressure on already strained financial stability.
Technical Analysis: GBP/JPY bullish trend at 209.00 and 210.00 areas
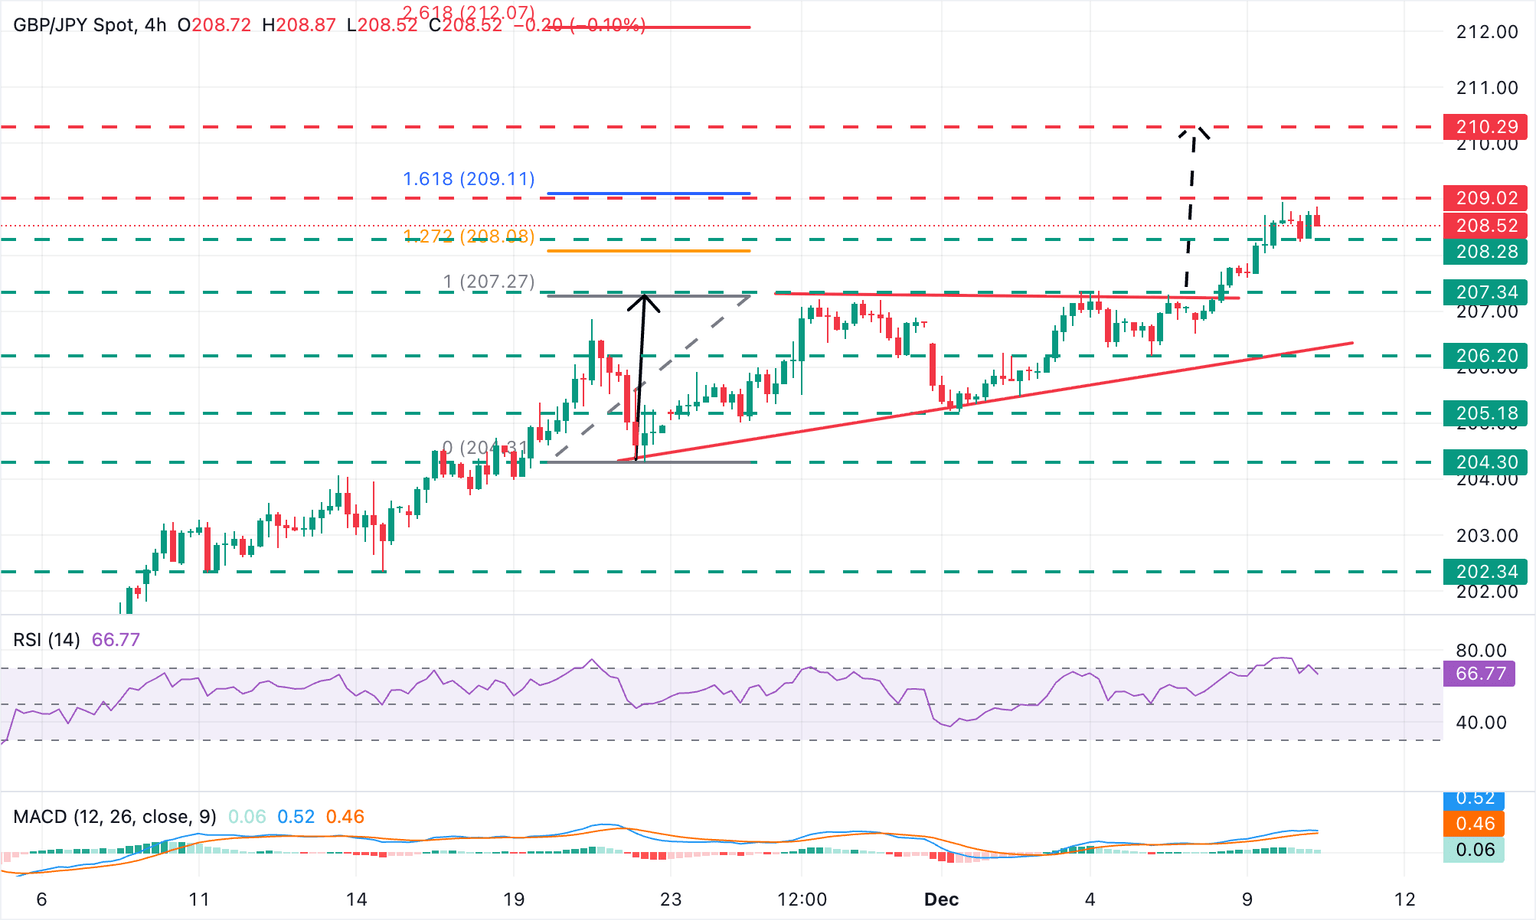
The technical picture shows that the pair is consolidating its gains after rising by about 1.7% over the past two weeks. The 4-hour chart shows the Relative Strength Index (RSI) pulling back from overbought levels with the Moving Average Convergence Divergence (MACD) printed as green bars, highlighting positive momentum.
Immediate support is at the intraday low of 208.24, just before the previous resistance area of 207.35 (highs of November 26 and 27 and December 3 and 5), which is likely to act as support now. In case of further decline, trend line support, around 206.30, and the December 5 low, at 206.20, appear as next targets.
On the upside, Tuesday’s high of 208.95 is close to the 161.8% Fibonacci extension of the November 20-26 rally, at 209.15. Confirmation above these levels will reveal the psychological level of 210.00. The measured target for the triangle is at 210.30.
The price of the Japanese yen this week
The table below shows the percentage change of the Japanese Yen (JPY) against the major currencies listed this week. The Japanese yen was the strongest against the Swiss franc.
| US dollars | euro | GBP | JPY | Canadian | Australian dollar | New Zealand dollar | Swiss franc | |
|---|---|---|---|---|---|---|---|---|
| US dollars | 0.10% | 0.18% | 0.96% | 0.14% | -0.09% | -0.18% | 0.15% | |
| euro | -0.10% | 0.11% | 0.91% | 0.08% | -0.15% | -0.23% | 0.09% | |
| GBP | -0.18% | -0.11% | 0.81% | -0.03% | -0.25% | -0.34% | -0.02% | |
| JPY | -0.96% | -0.91% | -0.81% | -0.80% | -1.02% | -1.10% | -0.77% | |
| Canadian | -0.14% | -0.08% | 0.03% | 0.80% | -0.22% | -0.31% | 0.00% | |
| Australian dollar | 0.09% | 0.15% | 0.25% | 1.02% | 0.22% | -0.09% | 0.23% | |
| New Zealand dollar | 0.18% | 0.23% | 0.34% | 1.10% | 0.31% | 0.09% | 0.32% | |
| Swiss franc | -0.15% | -0.09% | 0.02% | 0.77% | -0.01% | -0.23% | -0.32% |
The heat map shows the percentage changes in major currencies versus each other. The base currency is chosen from the left column, while the counter currency is chosen from the top row. For example, if you select the Japanese Yen from the left column and move along the horizontal line to the US Dollar, the percentage change displayed in the box will represent the Japanese Yen (base)/US Dollar (quote).

