
The EUR/GBP pair remains under pressure on Friday as the euro continues to decline against the widely supported British pound. The pound has remained steady since the UK’s Autumn Budget, even as markets maintain strong expectations for a rate cut from the Bank of England (BoE) at its December 18 meeting.
At the time of writing, EUR/GBP is trading around 0.8729, hovering near its lowest level since late October and on track for a third consecutive weekly decline.
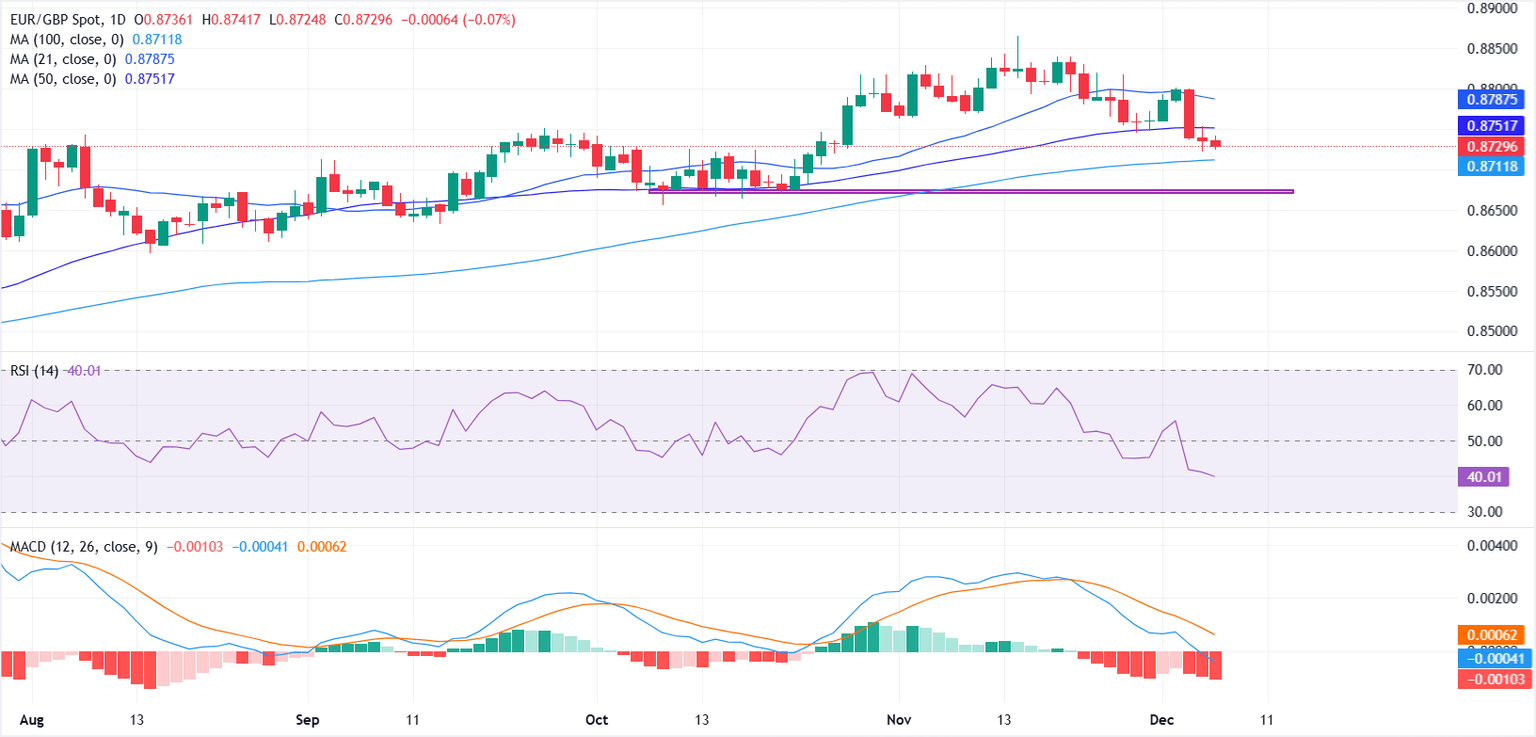
From a technical perspective, the EUR/GBP pair has been under steady downward pressure since it peaked near 0.8865 in mid-November, a level that represents the highest level in a year to date and the strongest reading since April 2023. The pair has since fallen below the 21-day and 50-day SMAs, showing a shift towards a softer structure in the near term with sellers remaining in control.
However, prices are still holding above the 100-day simple moving average near 0.8711, which is acting as an important immediate support area. A clear break below this area would increase the risk of a deeper pullback towards the 0.8670-0.8650 area.
Momentum indicators also support the downward trend. The Moving Average Convergence-Divergence (MACD) histogram has dropped into negative territory near the zero line, indicating fading upward momentum. The Relative Strength Index (RSI) stands at 39.83, below the midline and indicating weak traction but remains above oversold conditions.
On the upside, the 50-day simple moving average near 0.8751 represents the first hurdle, followed by the 21-day simple moving average around 0.8787. A break above both moving averages would help restore bullish momentum and open the door for a return towards the 0.8865 high and beyond.
The price of the British pound today
The table below shows the percentage change of the British Pound (GBP) against the major currencies listed today. The British pound was the strongest against the Japanese yen.
| US dollars | euro | GBP | JPY | Canadian | Australian dollar | New Zealand dollar | Swiss franc | |
|---|---|---|---|---|---|---|---|---|
| US dollars | -0.06% | -0.14% | 0.09% | -0.60% | -0.47% | -0.25% | -0.03% | |
| euro | 0.06% | -0.08% | 0.11% | -0.54% | -0.42% | -0.17% | 0.04% | |
| GBP | 0.14% | 0.08% | 0.19% | -0.45% | -0.33% | -0.11% | 0.12% | |
| JPY | -0.09% | -0.11% | -0.19% | -0.66% | -0.55% | -0.33% | -0.10% | |
| Canadian | 0.60% | 0.54% | 0.45% | 0.66% | 0.11% | 0.33% | 0.58% | |
| Australian dollar | 0.47% | 0.42% | 0.33% | 0.55% | -0.11% | 0.23% | 0.46% | |
| New Zealand dollar | 0.25% | 0.17% | 0.11% | 0.33% | -0.33% | -0.23% | 0.22% | |
| Swiss franc | 0.03% | -0.04% | -0.12% | 0.10% | -0.58% | -0.46% | -0.22% |
The heat map shows the percentage changes in major currencies versus each other. The base currency is chosen from the left column, while the counter currency is chosen from the top row. For example, if you select the British pound from the left column and move along the horizontal line to the US dollar, the percentage change displayed in the box will represent GBP (base)/USD (quote).

