
The EUR/USD pair trims some of its losses on Thursday, trading at 1.1636 at the time of writing, after bouncing from session lows near 1.1625. Stronger-than-expected euro zone industrial production numbers provided some support to the euro, which, however, remains dangerously close to its one-month low, at 1.1618.
Data released by Eurostat on Thursday revealed that industrial production in the euro zone advanced at a steady pace of 0.7% in November, versus market expectations of a moderate slowdown to 0.5%. On an annual basis, production growth accelerated to 2.5%, from 2% in October, exceeding the 2% increase expected by the market.
However, seen in the right perspective, the euro is maintaining its downward trend from its late December highs, as a list of fairly strong US macroeconomic numbers and waning concerns about the independence of the US Federal Reserve continue to support demand for the US dollar.
US data released on Wednesday showed a stronger-than-expected acceleration in producer prices and a strong rebound in retail consumption in November, providing further reasons for the Federal Reserve to keep interest rates unchanged in the coming months.
Moreover, US President Donald Trump calmed the markets, indicating that he has no plan to oust Federal Reserve Chairman Jerome Powell despite the criminal investigation against him. Investor concerns about the Fed’s independence sent the US dollar lower earlier in the week and prompted most of the world’s central bankers to sign a statement defending Powell.
Investors are now looking to manufacturing reports from the Federal Reserve Banks of New York and Philadelphia to confirm the improving US economic outlook in the fourth quarter of 2025. These numbers will frame the speeches of Fed policymakers later in the day.
Euro price today
The table below shows the percentage change of the Euro (EUR) against the major currencies listed today. The euro was the strongest against the Canadian dollar.
| US dollars | euro | GBP | JPY | Canadian | Australian dollar | New Zealand dollar | Swiss franc | |
|---|---|---|---|---|---|---|---|---|
| US dollars | 0.04% | 0.02% | -0.11% | 0.16% | -0.20% | -0.07% | 0.02% | |
| euro | -0.04% | -0.03% | -0.13% | 0.12% | -0.24% | -0.11% | -0.02% | |
| GBP | -0.02% | 0.03% | -0.11% | 0.15% | -0.21% | -0.09% | 0.00% | |
| JPY | 0.11% | 0.13% | 0.11% | 0.25% | -0.10% | -0.01% | 0.12% | |
| Canadian | -0.16% | -0.12% | -0.15% | -0.25% | -0.35% | -0.24% | -0.13% | |
| Australian dollar | 0.20% | 0.24% | 0.21% | 0.10% | 0.35% | 0.13% | 0.22% | |
| New Zealand dollar | 0.07% | 0.11% | 0.09% | 0.00% | 0.24% | -0.13% | 0.09% | |
| Swiss franc | -0.02% | 0.02% | -0.01% | -0.12% | 0.13% | -0.22% | -0.09% |
The heat map shows the percentage changes in major currencies versus each other. The base currency is chosen from the left column, while the counter currency is chosen from the top row. For example, if you select EUR from the left column and move along the horizontal line to USD, the percentage change displayed in the box will represent EUR (base)/USD (quote).
Daily summary of market drivers: US Producer Price Index and retail sales data support the US dollar
- The US dollar continues to rise against most of its peers, as US macroeconomic data supports the view that the Federal Reserve is likely to keep monetary policy unchanged in the coming months.
- On Wednesday, the US Producer Price Index report for November showed inflation accelerating to an annual pace of 3% from 2.8% the previous month, compared to expectations of a slowdown to 2.7%. Likewise, core PPI rose 3% over the year to November, from 2.9%, also against market expectations of 2.7%.
- The figures follow the release of the Consumer Price Index (CPI) on Tuesday, which showed flat readings in December and revealed that price pressures remain high in the US.
- Also on Wednesday, data from the US Census Bureau showed that retail sales grew at a rate of 0.6% in November, after a 0.1% decline in October, and beat market expectations for a 0.4% increase. The strong consumption numbers add to the strong US economic performance in the final quarter of the year and ease pressure on the Federal Reserve to lower borrowing costs further.
- Geopolitical tensions have eased somewhat, with President Trump stressing that he believes killings of protesters in Iran have declined, and US experts warning of the dangers of military intervention against the Islamic Republic. Oil and safe havens such as precious metals fell following the comments, which is also likely to weigh on the US dollar’s rise.
- In Europe, later on Thursday, Eurostat will release industrial production data in the euro zone. Factory output is expected to rise by 0.5% in November, after a 0.8% increase in October. Production is expected to grow year-on-year at a steady pace of 2%.
- In the US, the New York Empire State Manufacturing Index and the Philadelphia Fed Manufacturing Survey will provide some information on sector activity ahead of speeches by Atlanta Fed President Raphael Bostic, Governor Michael Barr, Richmond Fed President Thomas Barkin, and Kansas City Fed President Jeffrey Schmid.
Technical Analysis: EUR/USD is still close to its lows at 1.1618
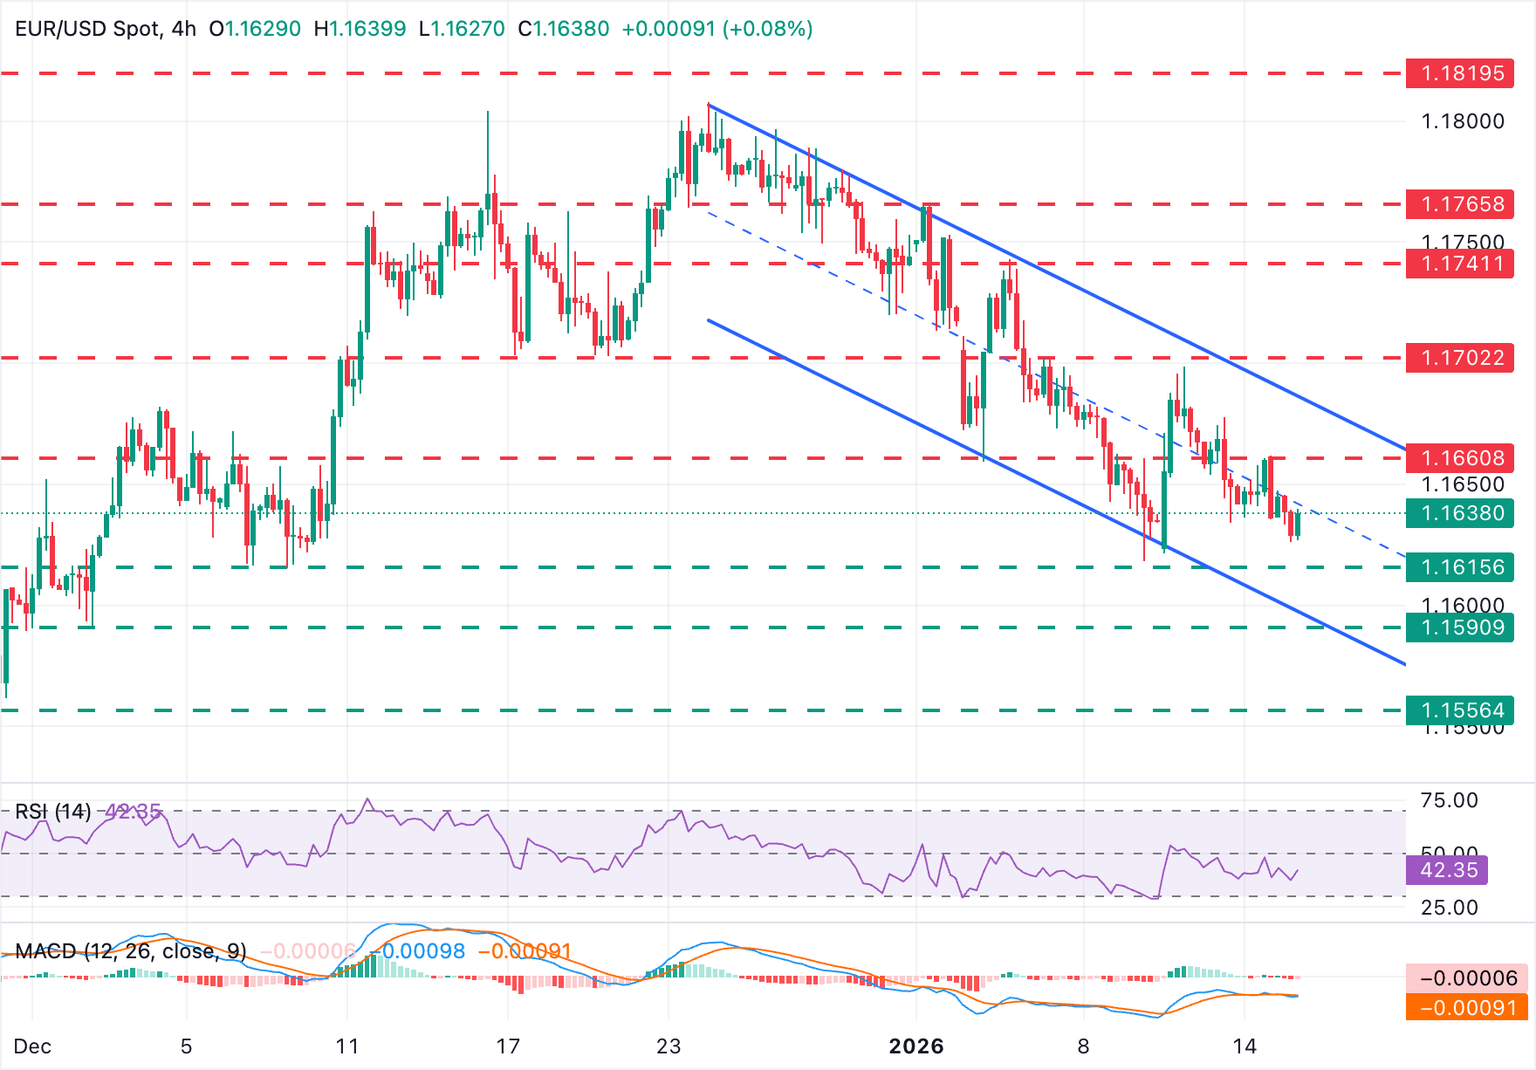
EUR/USD is trading near 1.1635 at the time of writing, extending its reversal from weekly highs near 1.1700 with price action contained within a descending channel since late December. The Moving Average Convergence Divergence (MACD) is holding around the zero line on the 4-hour chart, highlighting a neutral tone, while the Relative Strength Index (RSI) is pointing bearish at 38, indicating increasing bearish momentum.
The bearish move targets the January 9 low near 1.1615. In the event of further decline, the area between the bottom of the channel, now around 1.1600, and the December 2 low, at 1.1590, is likely to be targeted. On the upside, Wednesday’s high at 1.1660 may form some resistance before the channel top at 1.1690 and the January 12 high near 1.1700.
(The technical analysis for this story was written with the help of an artificial intelligence tool.)
Economic indicator
Industrial Production (monthly)
Industrial production index issued by Eurostat On a monthly basis, it measures changes in price-adjusted industry output. It is a widely followed indicator to measure the strength of the euro zone’s manufacturing sector. In general, a high reading is considered bullish for the EUR, while a low reading is considered bearish.
Read more.
Latest version:
Thursday, January 15, 2026 at 10:00
repetition:
monthly
actual:
0.7%
consensus:
0.5%
former:
0.8%
source:
Eurostat
Economic indicator
WDA Industrial Production (YoY)
Industrial production is issued by Eurostat. It shows the production volume of industries such as factories and manufacturing. An upward trend is considered inflationary which may lead to higher interest rates. Typically, if high growth in industrial production occurs, this may generate positive (or bullish) sentiment for the euro, while lower industrial production is seen as negative (or bearish) sentiment.
Read more.
Latest version:
Thursday, January 15, 2026 at 10:00
repetition:
monthly
actual:
2.5%
consensus:
2%
former:
2%
source:
Eurostat

