
The USD/JPY pair hit a new high in a year and a half near 159.45 during the early European trading session on Wednesday. The pair is strengthening as the Japanese Yen (JPY) continues to underperform across the board amid political uncertainty in Japan.
The price of the Japanese yen this week
The table below shows the percentage change of the Japanese Yen (JPY) against the major currencies listed this week. The Japanese yen was the weakest against the British pound.
| US dollars | euro | GBP | JPY | Canadian | Australian dollar | New Zealand dollar | Swiss franc | |
|---|---|---|---|---|---|---|---|---|
| US dollars | -0.08% | -0.28% | 0.73% | -0.21% | -0.20% | -0.21% | 0.08% | |
| euro | 0.08% | -0.20% | 0.87% | -0.12% | -0.11% | -0.12% | 0.16% | |
| GBP | 0.28% | 0.20% | 1.07% | 0.08% | 0.09% | 0.07% | 0.36% | |
| JPY | -0.73% | -0.87% | -1.07% | -0.97% | -0.96% | -0.97% | -0.68% | |
| Canadian | 0.21% | 0.12% | -0.08% | 0.97% | -0.01% | -0.00% | 0.29% | |
| Australian dollar | 0.20% | 0.11% | -0.09% | 0.96% | 0.00% | -0.01% | 0.27% | |
| New Zealand dollar | 0.21% | 0.12% | -0.07% | 0.97% | 0.00% | 0.01% | 0.27% | |
| Swiss franc | -0.08% | -0.16% | -0.36% | 0.68% | -0.29% | -0.27% | -0.27% |
The heat map shows the percentage changes in major currencies versus each other. The base currency is chosen from the left column, while the counter currency is chosen from the top row. For example, if you select the Japanese Yen from the left column and move along the horizontal line to the US Dollar, the percentage change displayed in the box will represent the Japanese Yen (base)/US Dollar (quote).
Concerns about the political outlook in Japan arose after reports that Prime Minister Sanae Takaishi may call early elections. According to Japanese regional news outlet Nikkei, Takaichi is set to announce her intention to dissolve parliament on Wednesday, paving the way for the start of new elections.
In addition, hopes for a more flexible monetary and fiscal policy this year leave the Japanese yen in a persistently weak position.
Meanwhile, the strength of the US Dollar (USD) is also acting as a tailwind for the pair. The US Dollar Index (DXY) is trading near its monthly high near 99.25, as speculation remains about the Federal Reserve (Fed) keeping interest rates steady, following the release of US inflation data for December. The data showed that the headline and core CPI in the United States rose steadily at an annual pace of 2.7% and 2.6%, respectively.
Technical analysis of the USD/JPY pair
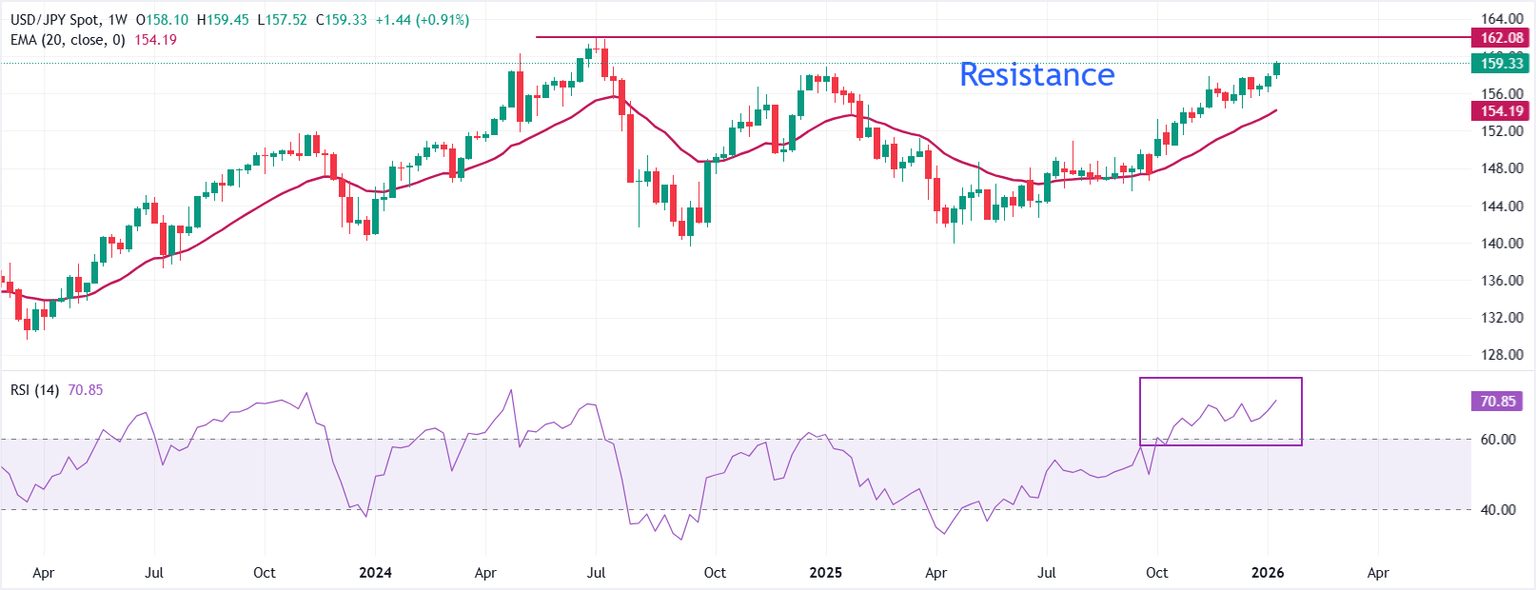
The USD/JPY pair is trading higher near 159.33 at the time of writing. The price is holding well above the 20-week Exponential Moving Average (EMA) at 154.19, confirming the strong uptrend.
The 14-week Relative Strength Index (RSI) at 70.85 (overbought) has extended momentum and increases the risk of a pause.
As momentum extends, further gains may slow, and consolidation may emerge. The decline is expected to find support at 154.19, the 20-week EMA, while the trend bias remains positive above this measure.
(The technical analysis for this story was written with the help of an artificial intelligence tool.)
Economic indicator
Consumer Price Index (annual)
Inflationary or deflationary trends are measured by periodically collecting the prices of a basket of representative goods and services and presenting the data as the Consumer Price Index (CPI). Consumer Price Index (CPI) data is compiled on a monthly basis and released by US Department of Labor Statistics. The annual reading compares commodity prices in the reference month with the same month of the previous year. The Consumer Price Index is a key indicator for measuring inflation and changes in purchasing trends. In general, a high reading is considered bullish for the US Dollar (USD), while a low reading is considered bearish.
Read more.
Latest version:
Tuesday 13 January 2026 at 1:30
repetition:
monthly
actual:
2.7%
consensus:
2.7%
former:
2.7%
source:
US Bureau of Labor Statistics
The US Federal Reserve has a dual mandate of maintaining price stability and maximum employment. According to this mandate, inflation should be around 2% year-on-year, and it has become the weakest pillar of the central bank’s guidance since the world suffered from the pandemic, which extends to the present day. Price pressures continue to rise amid supply chain issues and bottlenecks, with the Consumer Price Index remaining at multi-decade highs. The Fed has already taken measures to tame inflation and is expected to maintain a strong stance for the foreseeable future.

